


Are "Death Star" System Architecture Diagrams Going to Become the Norm?
Unpacking the complexity of ultra-detailed diagrams of modern software systems.

👋 Hi, this is Thomas, with a new issue of “Beyond Code: System Design and More”, where I geek out on all things system design, software architecture, distributed systems and… well, more.
In December of last year there was a viral AI art trend—‘make it more’—which resulted in some bizarre and hilarious images.
I couldn’t help myself so I tried it for system architecture diagrams. The conversation is as follows:
Me: A whiteboard after an hours-long engineering workshop to document the entire system architecture.
DALL‧E:

Me: Hm, good starting point. But this is a large distributed system with many components, services and dependencies.
DALL‧E:

Me: It’s a global deployment. It’s using a microservices architecture. You know what that means. More components.
DALL‧E:
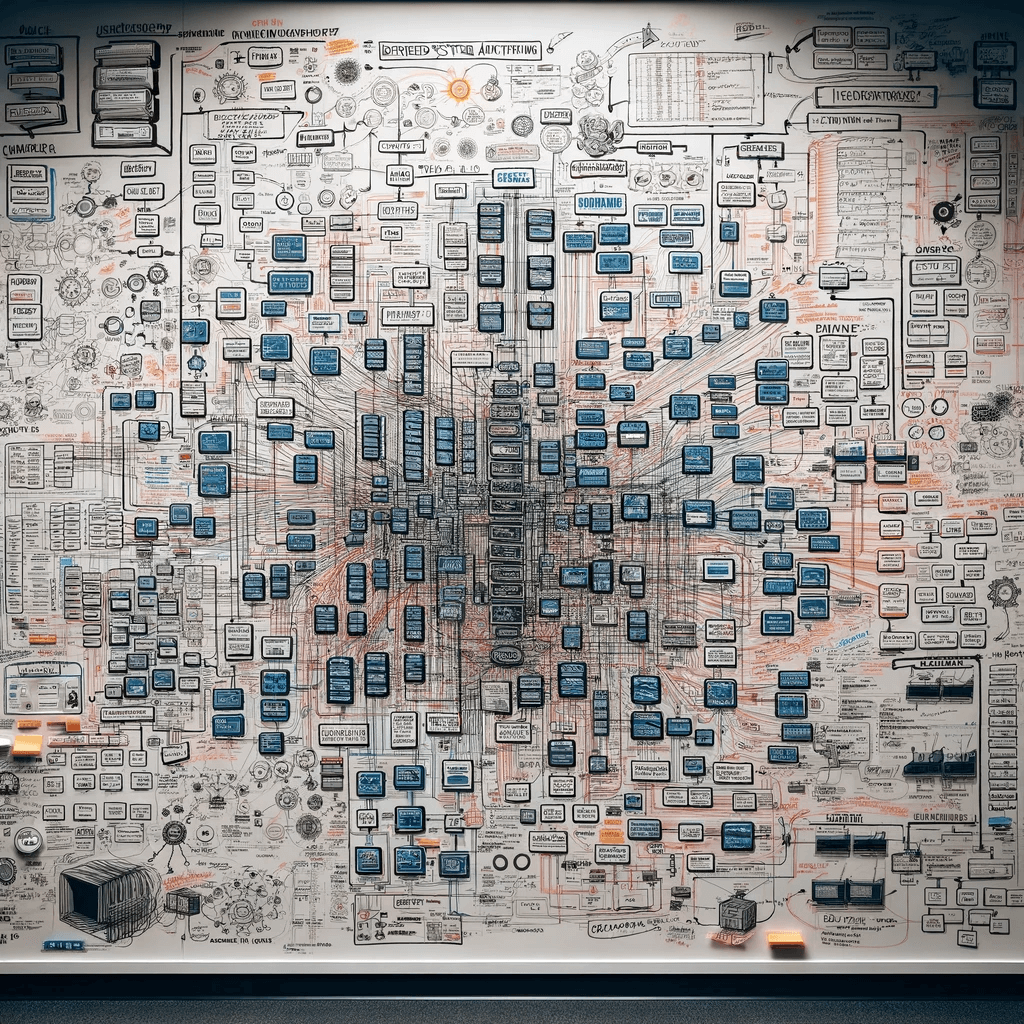
At the end, I can’t help but feel that I didn’t do this trend right: no matter how outlandish and overly complicated these diagrams may seem, they look fairly realistic to me.
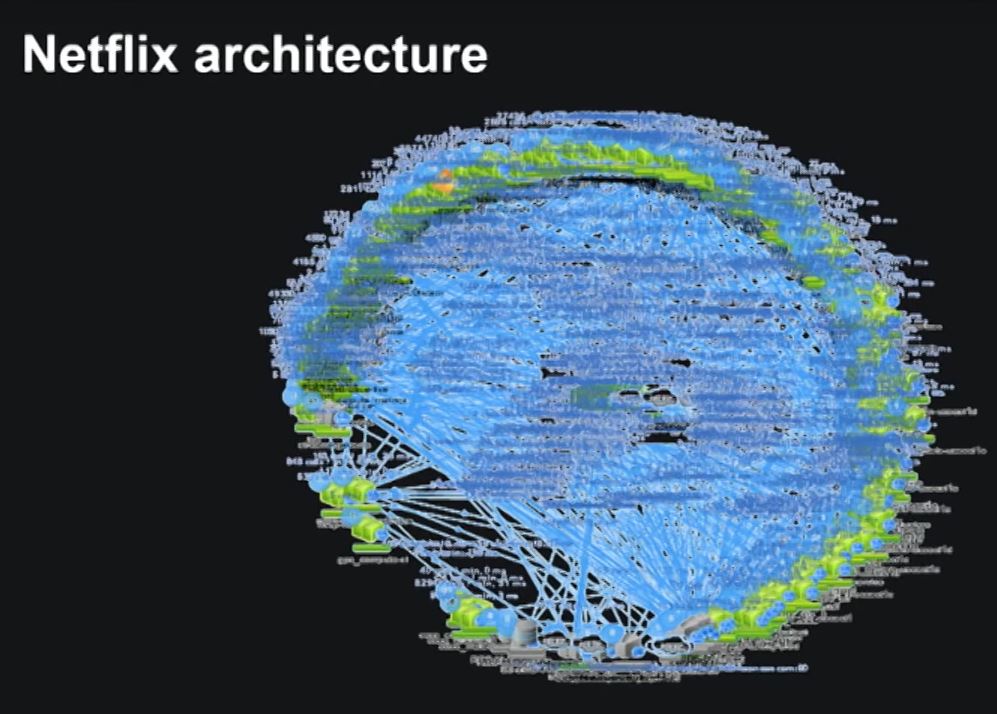
Indeed, after you’ve seen a few “death star” microservices diagrams (we all remember Netflix in 2015), these actually seem tame by comparison.
The Transition from System Architecture Diagrams to Death Stars
It’s very hard to objectively compare the experience of a backend developer today vs. 20 years ago (i.e. late 90s, early 00s): we’re solving different problems, using different tools and have exposure to different methodologies.
Yet, it’s undeniable that software systems are vastly more complex today because of these three main reasons:
Software Maturation: As software ages, its complexity escalates. Regular additions of features and integrations, along with occasional refactoring, contribute to a growing proportion of legacy systems that demand ongoing maintenance.
Technological Advancements: The adoption of cloud-native applications, distributed architectures, and APIs, along with the rise of SaaS and composable platforms, has layered additional complexity onto system architectures.
Accelerated Development Cycles: Agile practices and methodologies such as Continuous and Evolutionary Architecture have quickened the pace of changes within software systems. Today's competitive environment necessitates the creation of adaptable systems that can swiftly evolve to meet new technological, infrastructural, and business demands.
The combination of these factors means that traditional static system diagrams quickly become overwhelmed, turning into 'Death Stars'—highly complex visual representations that are difficult to decipher due to the sheer number of components and the intricacy of their interactions.
The core issue, however, lies not with the system architectures themselves but with the outdated diagramming tools we employ to visualize and understand them.
Current diagramming tools fall short in capturing the full scope of modern systems, necessitating a shift towards more dynamic and comprehensive visualization technologies that can keep pace with the complexity of today's architectural environments.
We Need Better Diagramming Tools
Diagrams serve as a fundamental visual language that simplifies the understanding of system dependencies, communication pathways, and overall architecture. They are essential tools that enable developers, architects, and stakeholders to grasp both the broad scope and the detailed intricacies of a system's structure.
When evaluating diagramming tools, it's essential to prioritize features that align with the dynamic nature of modern systems. Two critical features stand out:
Real-Time Visualization: Effective diagramming tools must provide up-to-date representations of the system's architecture. This means they should automatically update to reflect real-time states and changes within the system, eliminating the need for frequent manual revisions. This dynamic capability ensures that all team members have immediate access to the latest architectural insights, facilitating more informed decision-making and quicker adaptations to new requirements.
Adaptive Complexity Levels: Modern diagramming tools need to offer adjustable levels of detail, allowing users to tailor the complexity of the visualizations according to their specific needs. Whether it’s providing a high-level overview or delving into the granular details of each component’s dependencies, the tool should allow seamless navigation between different abstraction layers. This flexibility is crucial for addressing the varying needs of different stakeholders who may require different perspectives on the system for their roles.
These enhancements to diagramming tools are not just improvements but necessities (and some projects like Multiplayer are actively working to make this a reality).
📚 Interesting Articles & Resources
“Developer Experience: Stuck Between Abstraction and a Hard Place?” - Jean Yang
Why we need complexity-embracing tools to help us navigate modern systems.
“Why are architecture diagrams never up-to-date?” - Living In Software
Depending the purpose of your diagrams it may not matter if it’s up-to-date, but at some point you’ll likely require an up-to-date version.
“Microservices Diagram: Best Practices & Examples” - Thomas Johnson
A deep dive into key microservices diagram best practices and examples.